
 PDF版 Demo
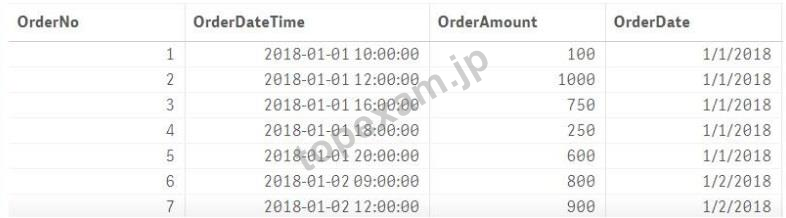
弊社のQlik QSBA2018を利用すれば試験に合格できます
弊社のQlik QSBA2018は専門家たちが長年の経験を通して最新のシラバスに従って研究し出した勉強資料です。弊社はQSBA2018問題集の質問と答えが間違いないのを保証いたします。

この問題集は過去のデータから分析して作成されて、カバー率が高くて、受験者としてのあなたを助けて時間とお金を節約して試験に合格する通過率を高めます。我々の問題集は的中率が高くて、100%の合格率を保証します。我々の高質量のQlik QSBA2018を利用すれば、君は一回で試験に合格できます。
安全的な支払方式を利用しています
Credit Cardは今まで全世界の一番安全の支払方式です。少数の手続きの費用かかる必要がありますとはいえ、保障があります。お客様の利益を保障するために、弊社のQSBA2018問題集は全部Credit Cardで支払われることができます。
領収書について:社名入りの領収書が必要な場合、メールで社名に記入していただき送信してください。弊社はPDF版の領収書を提供いたします。
弊社は失敗したら全額で返金することを承諾します
我々は弊社のQSBA2018問題集に自信を持っていますから、試験に失敗したら返金する承諾をします。我々のQlik QSBA2018を利用して君は試験に合格できると信じています。もし試験に失敗したら、我々は君の支払ったお金を君に全額で返して、君の試験の失敗する経済損失を減少します。
一年間の無料更新サービスを提供します
君が弊社のQlik QSBA2018をご購入になってから、我々の承諾する一年間の更新サービスが無料で得られています。弊社の専門家たちは毎日更新状態を検査していますから、この一年間、更新されたら、弊社は更新されたQlik QSBA2018をお客様のメールアドレスにお送りいたします。だから、お客様はいつもタイムリーに更新の通知を受けることができます。我々は購入した一年間でお客様がずっと最新版のQlik QSBA2018を持っていることを保証します。
弊社は無料Qlik QSBA2018サンプルを提供します
お客様は問題集を購入する時、問題集の質量を心配するかもしれませんが、我々はこのことを解決するために、お客様に無料QSBA2018サンプルを提供いたします。そうすると、お客様は購入する前にサンプルをダウンロードしてやってみることができます。君はこのQSBA2018問題集は自分に適するかどうか判断して購入を決めることができます。
QSBA2018試験ツール:あなたの訓練に便利をもたらすために、あなたは自分のペースによって複数のパソコンで設置できます。
TopExamは君にQSBA2018の問題集を提供して、あなたの試験への復習にヘルプを提供して、君に難しい専門知識を楽に勉強させます。TopExamは君の試験への合格を期待しています。
Qlik Sense Business Analyst Certification Exam - June 2018 Release 認定 QSBA2018 試験問題:
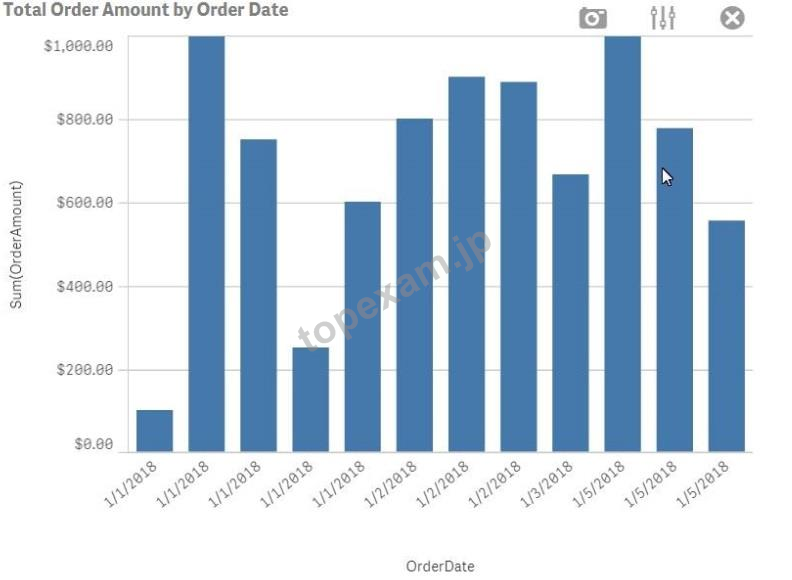
1. Refer to the exhibit.
A range of colors between red (using code RGB(229.20,0)) and green (using code RGB(164T196,23)) needs to be used as a gradient in a scatter plot that displays sales and cost by store The gradient needs to produce visualization shown in the exhibit What is the most efficient method a business analyst should use to meet this requirement?
A) Create a new calculation in the data model with the Colormix1 function that can be used as a gradient in the visualization
B) Modify the visualization to set a color for the data points with an expression based on a Colormix1 function
C) Modify the default CSS file to produce the required color gradient
D) Create a new measure in the master items with the Colormix2 function so that the gradient can be used in any visualization
2. A Qlik Sense Enterprise data architect creates and publishes an app to a stream and gives access to users
* The users do NOT have access to Qlik Management Console
* All dimensions and measures used in the app are created in the master items library Which two actions can the users perform? (Select two.)
A) Export the data model to a QVD format and load it into another app
B) Export the app from the hub and open it in Qlik Sense Desktop
C) Create a calculated measure for a chart and add it to master items
D) Create charts using dimensions and measures from master items
E) Export stories created in the app to a PDF or PowerPoint format
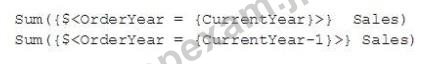
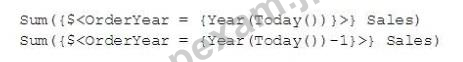
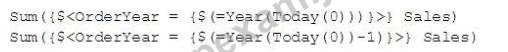
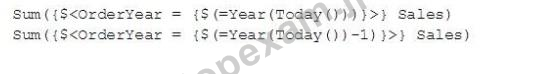
3. A business analyst needs to create an app showing sales data. The app requirements are as follows
* Compare sales for the current year (CY Sales) versus last year (LY Sales)
* CY Sales must always be displayed in blue
* LY Sales must always be displayed in yellow
Which steps should the business analyst take to meet these requirements?
A) 1. Create CY Sales and LY Sales measures as master items and set the required color for each measure 2 Create one KPI from the two master item measures
B) 1 Create a KPI with two measures, CY Sales and LY Sales
2 Write an IF expression to set the appropriate colors for each measure
C) 1. Create CY Sales and LY Sales measures as master items
2 Write an IF expression to set the appropriate colors for the master items
D) 1 Create CY Sales and LY Sales measures as master items and set the required color for each measure using Value colors
2 Create two gauges, one for each measure and set the color for each appropriately
4. A business analyst uses the data manager to load customer data from a QVD file. The data manager automatically profiles the data, and recognizes City and Country values as Geo data.
The app must meet the following requirements;
* Country field should be in Geo data format
* City should NOT be allowed as a mapping option for the users
* There must be an association between the Country and City fields
Which actions should the business analyst take to meet these requirements?
A) 1 In the Associations view select the City field
2 Delete the City field
B) 1. In the Associations view, select the City field
2 Change the format from 'Geo data' to 'General'
C) 1. In the Associations view, select the City field
2 Change the format from 'Geo data' to 'No data profiling'
D) 1. In the Associations view, select the City field
2 Delete Sgeoname-tag from field properties
5. A CEO of an automotive manufacturing company wants a single dashboard sheet to track the company's sales.
The app must meet several requirements:
* All charts must be on one sheet
* Show summary charts of key performance data
* Ability to scroll up and down the sheet
Which set of actions should the business analyst use to meet these requirements?
A) * Adjust grid spacing
* Activate Extend sheet
B) * Adjust grid spacing
* Use Insight Advisor
C) * Use KPI objects
* Use Insight Advisor
D) * Use KPI objects
* Activate Chart assistance
質問と回答:
| 質問 # 1 正解: B | 質問 # 2 正解: C、D | 質問 # 3 正解: B | 質問 # 4 正解: D | 質問 # 5 正解: A |


 品質保証TopExamは我々の専門家たちの努力によって、過去の試験のデータが分析されて、数年以来の研究を通して開発されて、多年の研究への整理で、的中率が高くて99%の通過率を保証することができます。
 一年間の無料アップデートTopExamは弊社の商品をご購入になったお客様に一年間の無料更新サービスを提供することができ、行き届いたアフターサービスを提供します。弊社は毎日更新の情況を検査していて、もし商品が更新されたら、お客様に最新版をお送りいたします。お客様はその一年でずっと最新版を持っているのを保証します。
 全額返金弊社の商品に自信を持っているから、失敗したら全額で返金することを保証します。弊社の商品でお客様は試験に合格できると信じていますとはいえ、不幸で試験に失敗する場合には、弊社はお客様の支払ったお金を全額で返金するのを承諾します。(
 ご購入の前の試用TopExamは無料なサンプルを提供します。弊社の商品に疑問を持っているなら、無料サンプルを体験することができます。このサンプルの利用を通して、お客様は弊社の商品に自信を持って、安心で試験を準備することができます。